
Capabilities
Take your business to the next levelDelivers a comprehensive information portal for a single point of access to reporting, information visualisation and intelligent decision support.
- Extensible – Delivers off-the-shelf features but with the ability to rapidly extend and personalise to meet your organisation’s information needs.
- Responsive – Desktop, tablet and mobile device friendly portal to ensure that you have access to information wherever you are.
- Secure – Single sign-on platform using Amazon Web Services Identity and Access Management with one or more user role assignments to groups possible. Fine-grained control of access to information based on user role assignment. Comprehensive audit trails of user activity.
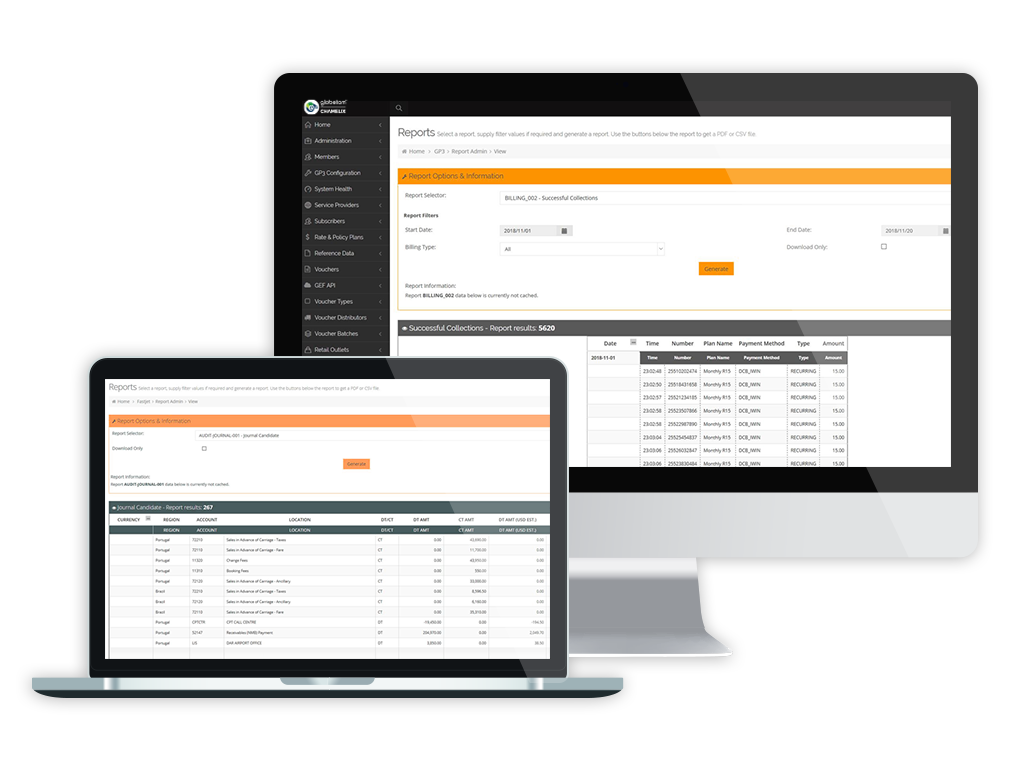

Enterprise Information Portal
Delivers a comprehensive information portal for a single point of access to reporting, information visualisation and intelligent decision support.
- Extensible – Delivers off-the-shelf features but with the ability to rapidly extend and personalise to meet your organisation’s information needs.
- Responsive – Desktop, tablet and mobile device friendly portal to ensure that you have access to information wherever you are.
- Secure – Single sign-on platform using Amazon Web Services Identity and Access Management with one or more user role assignments to groups possible. Fine-grained control of access to information based on user role assignment. Comprehensive audit trails of user activity.
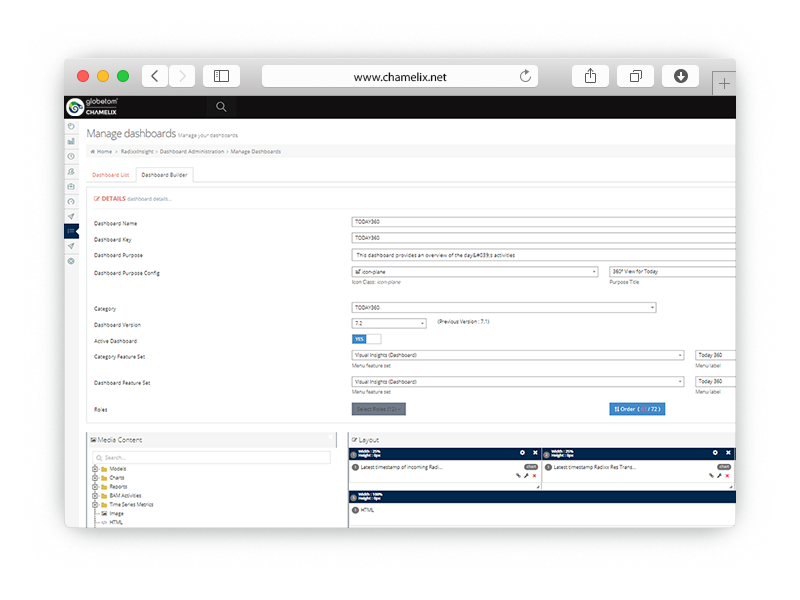
Dashboard Builder
Delivers the ability to use a drag-and-drop user interface to construct your own personalised dashboards.
- Drag-and-drop dashboard building – Design, build, version and deploy your own dashboards to enrich your enterprise information portal.
- Accurate visual information – When building dashboards, you use a library of defined reports and charts or predefined widgets. This ensures that your dashboards use accurate, certified source data.
- User access control – Control access to your new dashboards using the user role assignment to ensure that only authorised users are granted access.
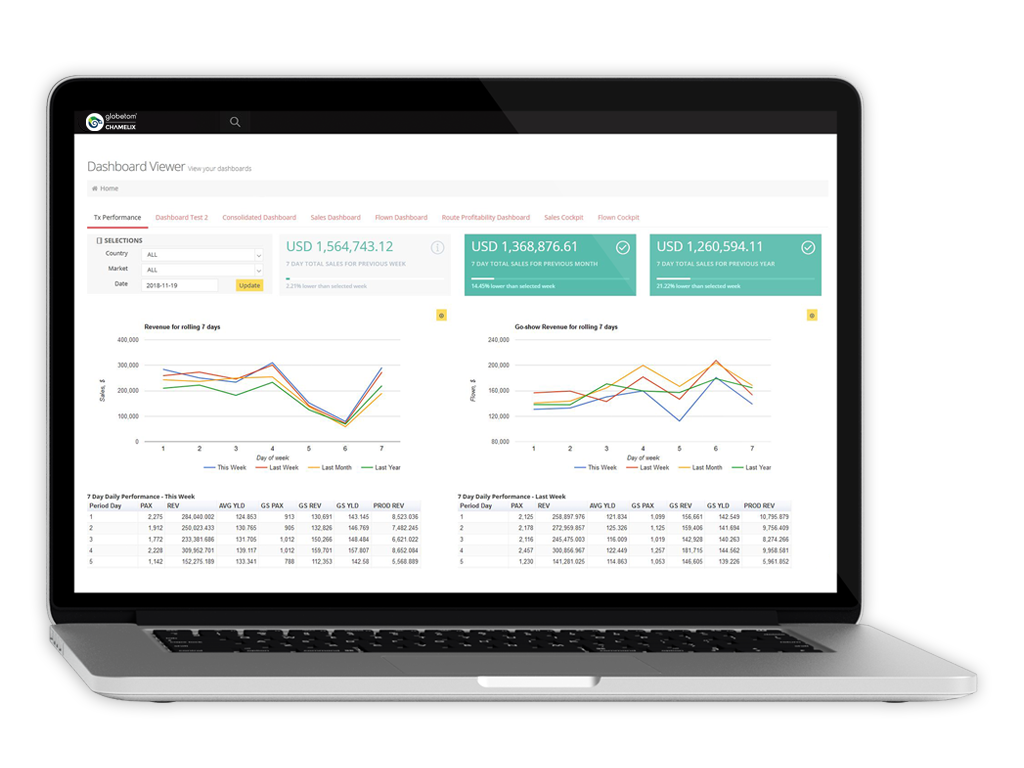
Dashboard Viewer
Visualise organisational insights using a rich dashboard viewer with drill-through capabilities.
- User role-based information visualisation – Delivers off-the-shelf features but with the ability to rapidly extend and personalise to meet your organisation’s information needs.
- Responsiveness – Desktop, Tablet and Mobile Device friendly portal to ensure that you have access to information wherever you are and that information visualization is responsive across device types.
- Drill-through Capability – Add multi-dimensional drill-through capabilities with dashboard configuration to allow top-down information visualisation.
- Dashboard Contextualisation – Present different dashboards as landing pages to users based on user roles.
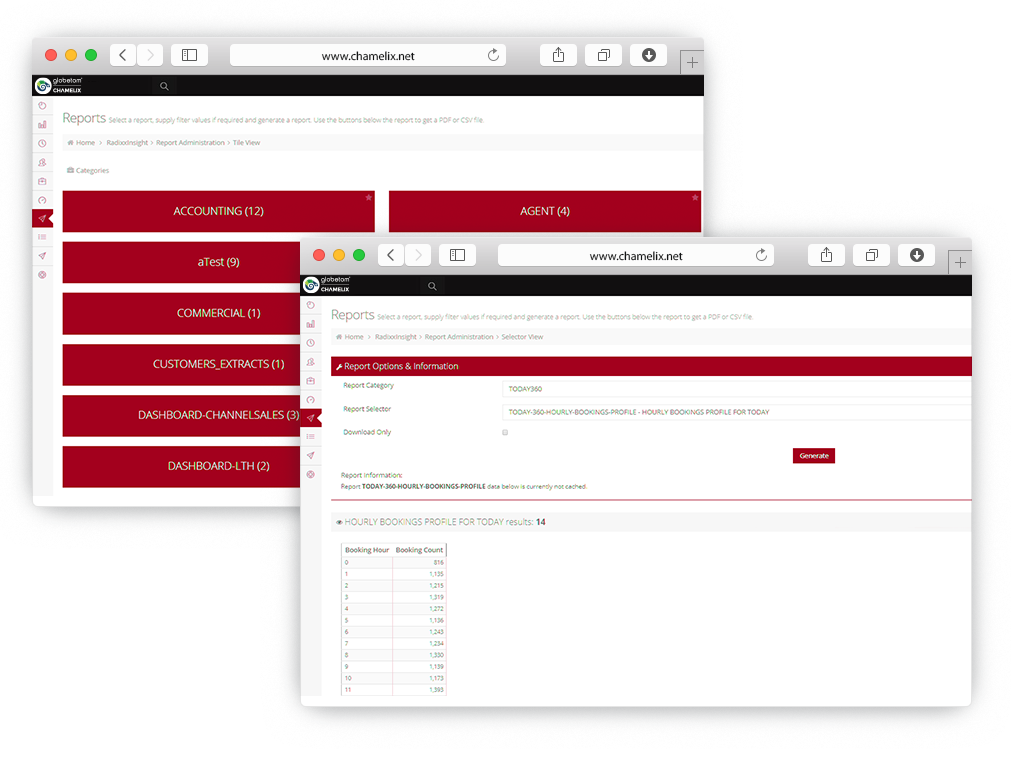
Report Viewer
Comprehensive out of the box report navigation functions to access the correct report instantly.
- User role-based access control to reports – Each report is assigned to one or more user roles to ensure that only authorised users in your organisation can access reports.
- Intelligent report data rendering – Intelligent detection of report data volumes to render large data volumes to users optimally.
- Report downloads – Download reports in CSV (Excel) or PDF data format
- Report Caching – Define report caching rules at design time to reuse cached report data to preserve database back-ends.
- Graphs attached to reports – Add multiple graphs to reports to enhance data visualisation.
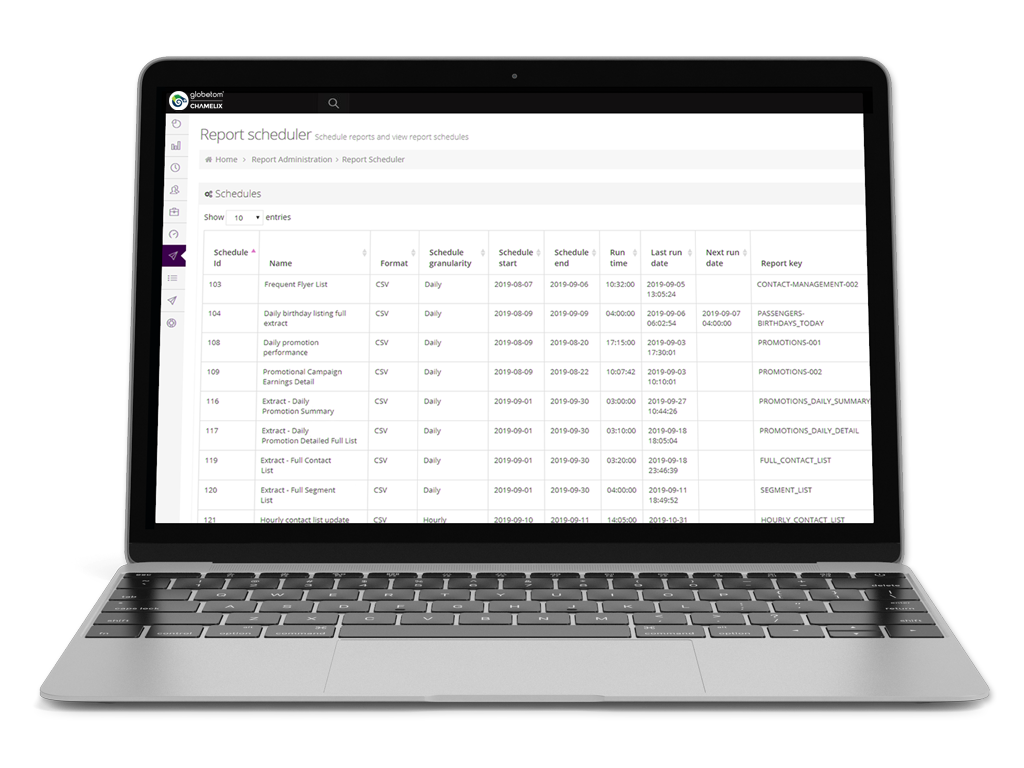
Report Scheduler
Schedule any pre-existing report for delivery on time to one or more interest groups using time-interval schedules.
- Schedule any report – Set up schedules for any predefined report, including your own reports built with the extract builder.
- Interest group type support – Deliver reports to one or more interest groups with the ability to mix interest group types, e.g. deliver a report via e-mail as well as to an AWS S3 bucket or a Google Cloud Store folder.
- ETL (Extract, Transform and Load) support – Every time a scheduled report is delivered, a publish and subscribe message is delivered for post-delivery load processing. This enables full ETL using the scheduler to externalise data to Data Warehouses or other enterprise application.
- Accurate delivery audit log – An accurate report schedule, delivery and post-delivery load audit log is generated for reporting on the integrity of scheduled report delivery.
Demand Scheduler
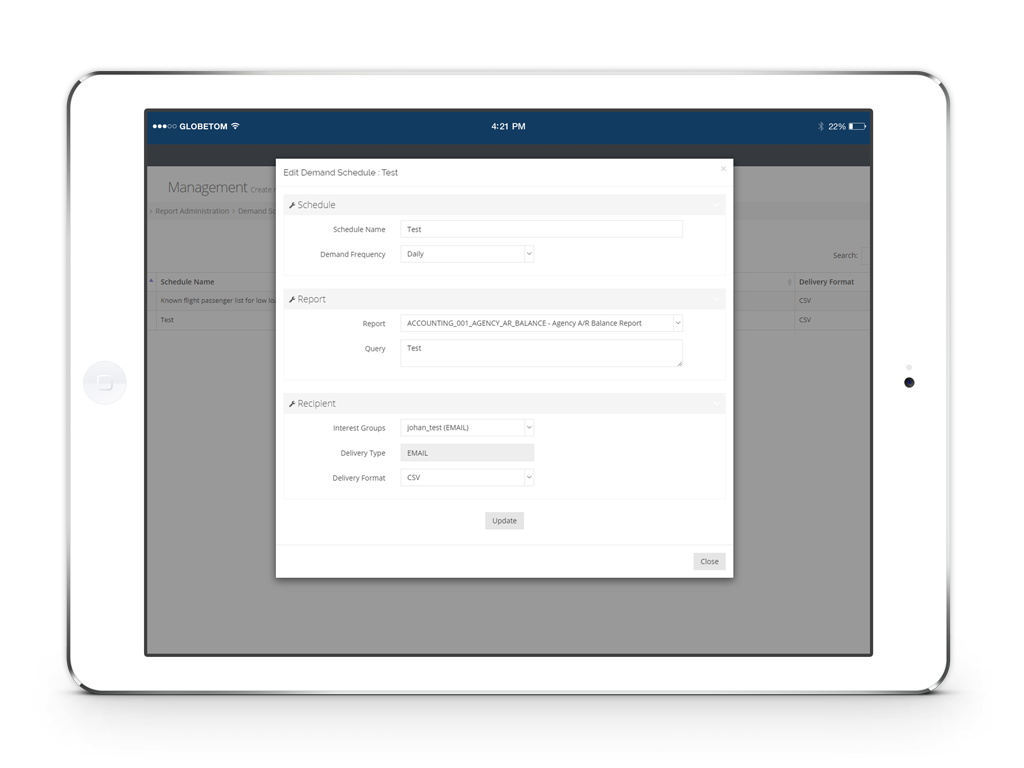
Run periodic data analysis with data extracts and for each row returned, generate a predefined report and send to an interest group.
- Set demand trigger criteria – Set up a scheduled check for specific conditions using a defined data as source.
- Trigger predefined report – Based on a trigger condition being met, send a predefined report to an interest group for each row returned by the demand trigger query.
- Inform business stakeholders – Use the demand scheduler to inform business stakeholders about trigger events when business conditions happen.
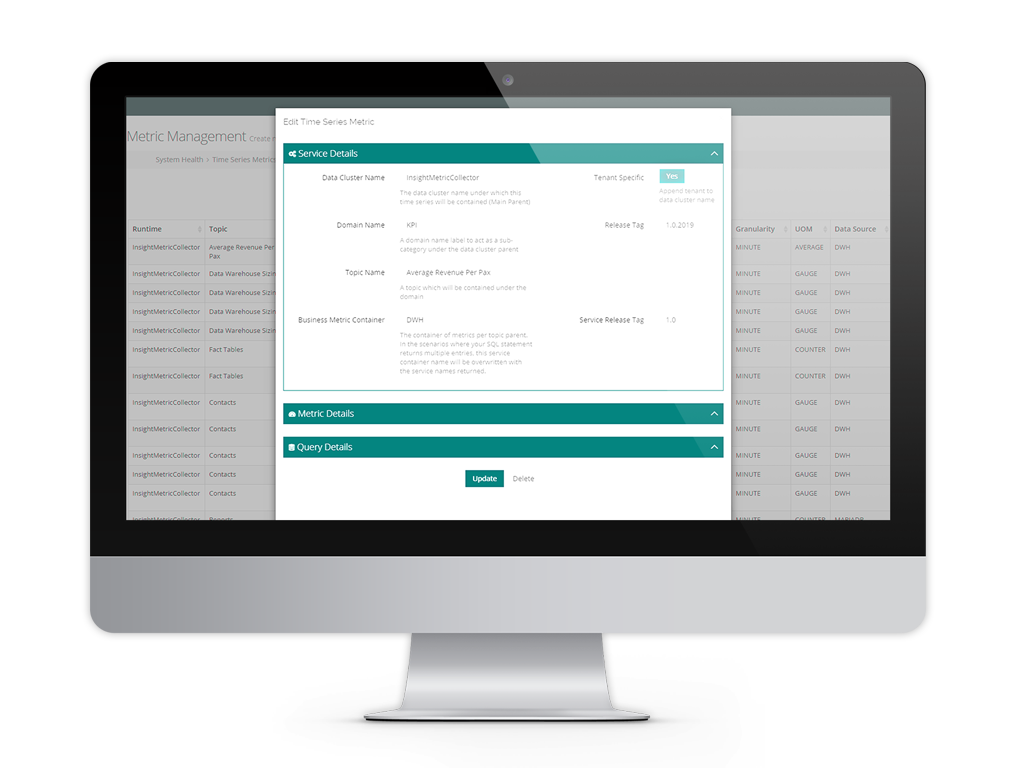
KPI Metric Cache
Schedule any standard report as well as your custom reports for delivery on time to one or more interest groups.
- Schedule any report – Set up schedules for any predefined report, including your own reports built with the extract builder.
- Interest Group Type Support – Deliver reports to one or more interest groups with the ability to mix interest group types, e.g. deliver a report via e-mail as well as to an AWS S3 bucket.
- ETL support – An accurate report schedule, delivery and post-delivery load audit log.
- Accurate delivery audit log – An accurate report schedule, delivery and post-delivery load audit log.
Business and Service Activity Monitor
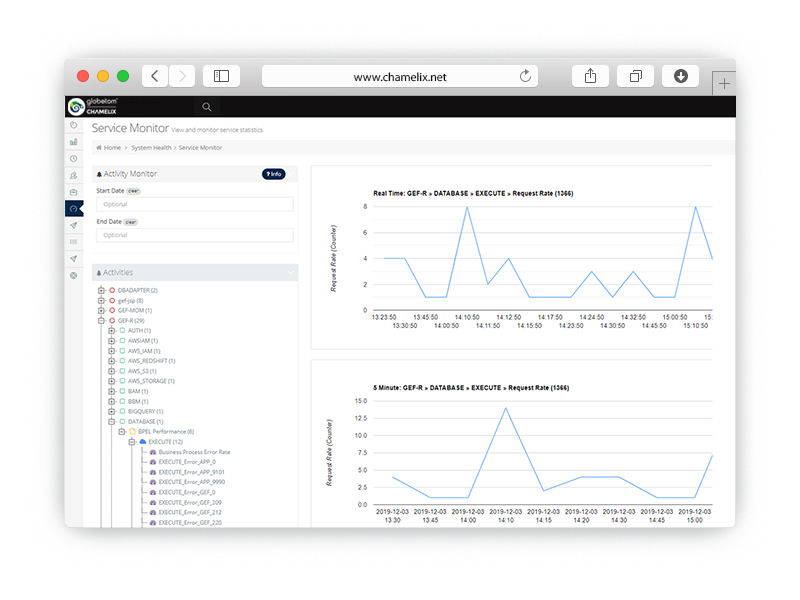
The Chamelix platform includes a comprehensive service and business activity monitor data store.
- Governance – Each service and every business metric of interest is recorded.
- Rollup KPI Metric Values – Real-time metric data is rolled up into 5-minute, hourly, daily and monthly metric values with moving average calculations.
- Error rates and processing times – All data integration services or other ELT services are governed from an error rate and latency perspective.
- Summary Views – Metrics can easily assembled into materialised views.
Need more info?
Would you like more information? Get in touch to discuss the right solution for your business.
Contact Us